Case Study 01
Archaster Labs — founder, 0 to 1.
Archaster Labs · 2024 – present · Founder (2 co-founders) · Live since June 2026 · Bootstrapped
Open nature data isn't the same as accessible nature data. And most decisions about land — what to source, where to build, what to restore — are made blind to the condition of the land itself. The data exists: satellites pass every five days, deforestation alerts are near-real-time, there's a forty-year record of surface water. The signal is rich, peer-reviewed, and often free.
Reading it together — for one specific decision, on one specific piece of ground — is geospatial engineering work. So the person who holds the decision hands their question to a spatial-data specialist and waits, and gets back a static answer weeks later, if the context survived the handoff.
I positioned Archaster as the layer between that data and the person deciding: no geospatial expertise required, no scientific defensibility given up. Both halves are load-bearing. Drop the first and you've built another expert tool. Drop the second and you've built a score that makes greenwashing easy.
- Company
- Archaster Labs (0 → 1) · 2024 – present
- Status
- Live since June 2026
- Core squad
- CEO/CPO (me) · CTO (co-founder, part-time)
- Role
- Founder — product vision, strategy, design, and occasionally build in code with AI agents
- Product
- Nature intelligence platform for the domain experts who decide what gets sourced, built, and restored, without needing a geospatial background.
- Users
- Sourcing, design/materials, restoration and sustainability domain experts. Not spatial analysts.
Screenshots of Archaster Labs software
Deciding what to see
Before any of this was designed, I spent roughly a year teaching myself satellite and geospatial science.
Enough to make the call the whole product rests on: what should it measure?
The raw data is public and mostly free. Sentinel-2, GBIF, the JRC water record, Global Forest Watch. Every hard part is downstream of that: which datasets, at which resolution, synthesised how, and made legible to someone who can't check the work themselves.
Biodiversity is the clearest case. The obvious build is a species list: count the records, show the names. Every tool does it, because it's what the data hands you. But a sourcing lead can't act on a species count. What they can act on is a missing ecological function — no pollinators recorded where the crop depends on them, no soil engineers where the soil has to keep working.
There was no off-the-shelf grouping for this. The ecological literature describes functional roles, but not in a form a procurement team can read. So I built one: nine functional groups, grounded in the research, each chosen for what it tells someone deciding where to source or restore.
The pollinator split shows the logic. Ants and mosquitoes sometimes move pollen, so a trait-based grouping files them as pollinators — but they don't pollinate reliably, and their real function in the system is something else. So the categories are built around what a species dependably does for the decision, not around everything it's been observed doing. That distinction is the difference between a biodiversity readout that's true and one that's useful.
The same test applies to every layer: not "is this data available" but "does a decision turn on it".
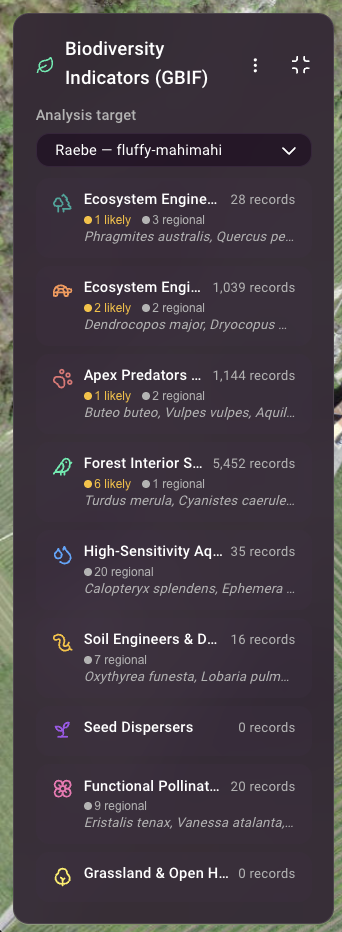
Biodiversity functional groups, built for decisions rather than species lists
Reading a landscape
Not just showing its data.
The product doesn't hand you data layers to interpret — it reads them together via an AI that labels how much it knows for the decision in front of you.
The AI analysis is based in the actual spatial data and always labeled by how far it sits from it.
I built the reasoning system on top of Gemini's and Anthropic's models: the frameworks it's grounded in, the system prompt, the role-based personas that answer as a procurement, sustainability, or materials lead rather than one voice for everyone. And the part that matters most in a domain where a confident wrong answer is dangerous — every claim is labeled by how it's known: observed, derived, inferred, or projected.
It leads with a TL;DR, and ends every analysis with three questions that would sharpen it, so the user sees what the data couldn't tell them on its own. It never rolls the signals into a single score.
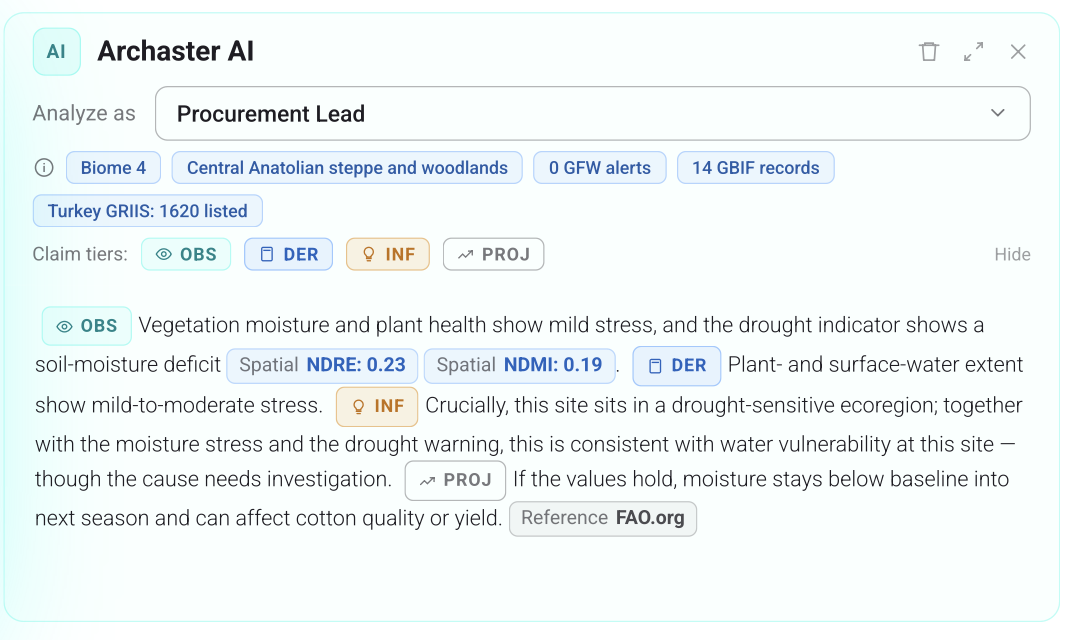
Buffer zones
A site with two deforestation alerts inside its boundary and forty-two in the surrounding two kilometres is not the same as a site with none. One is stable. The other is intact today. The product reads which one you're looking at — because "this supplier is fine" and "this supplier is fine today" carry different implications.
Other tools don't automatically add buffer zones around sites. We decided to do that and used rings that are widely applied in practice: 500m for local edge effects and 2km for regional landscape context.
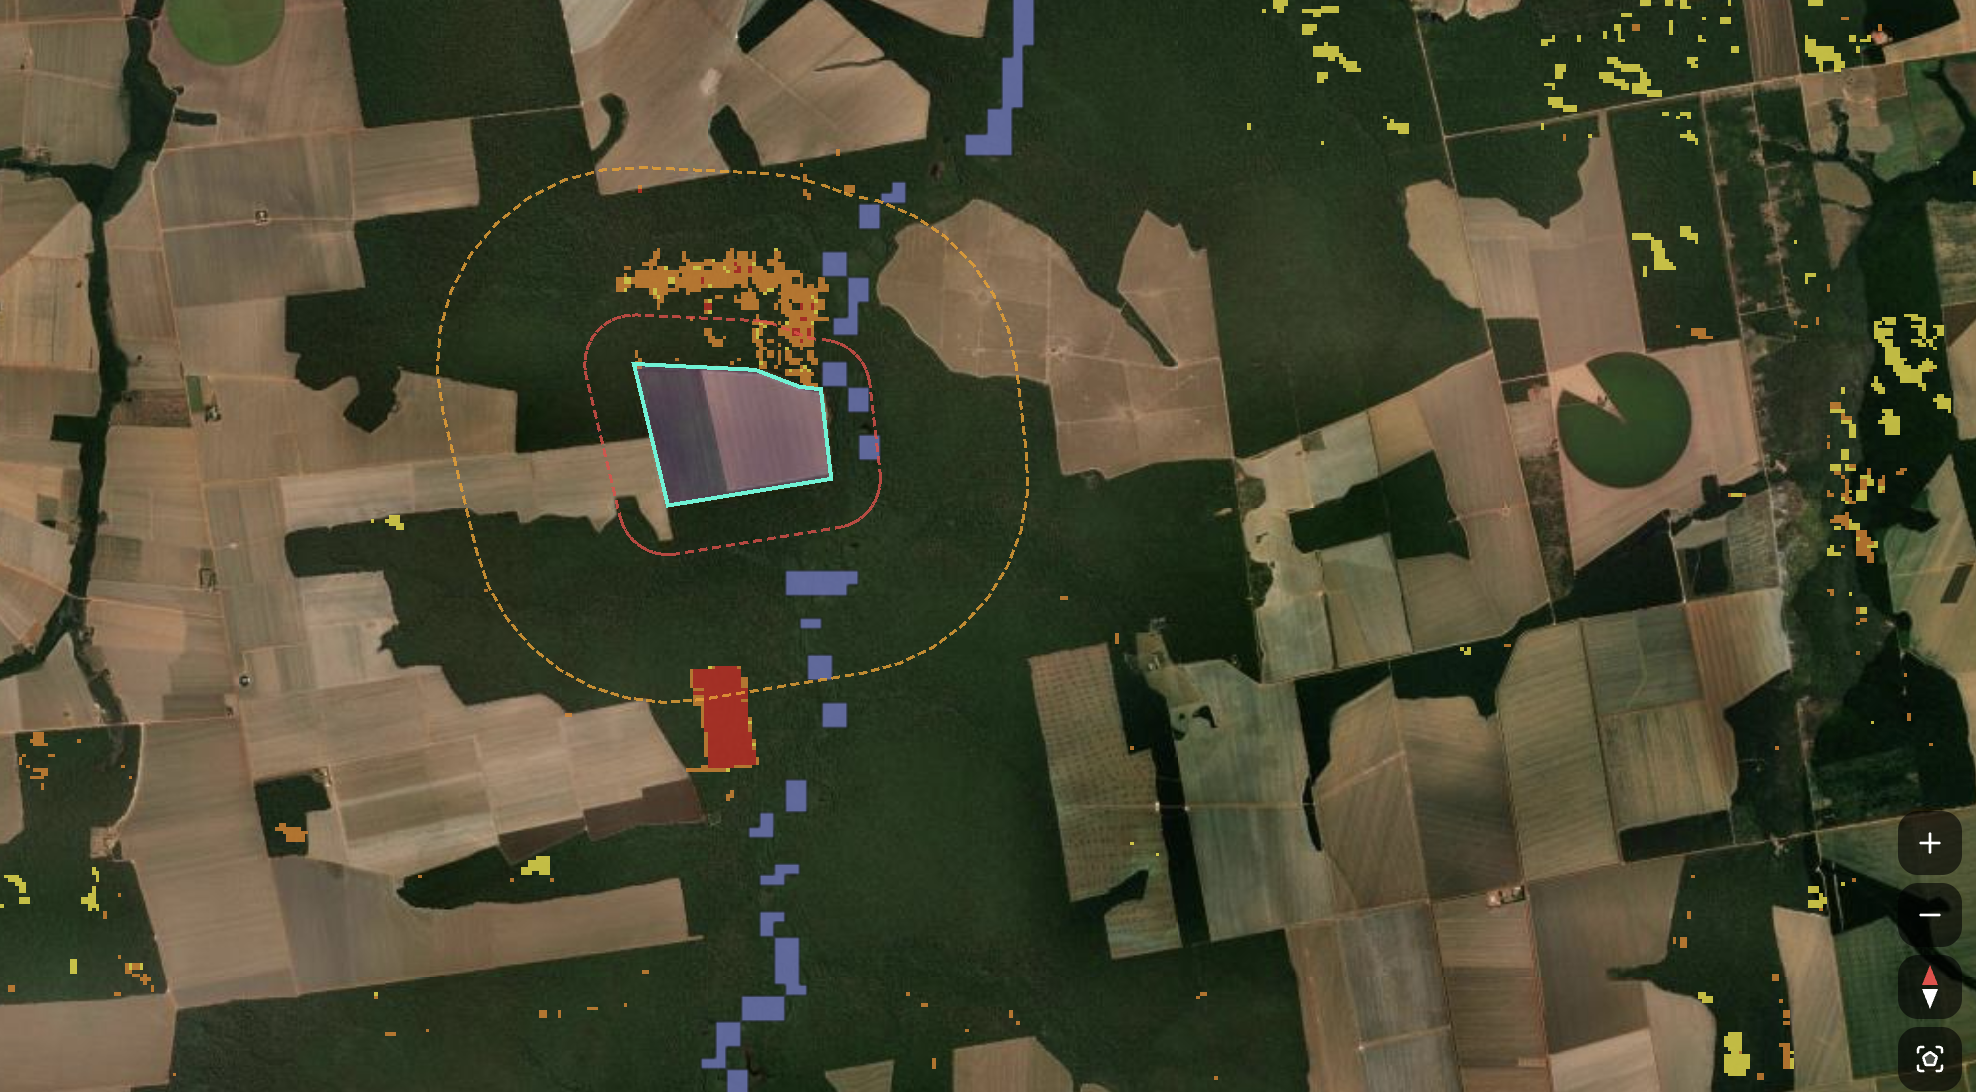
Saying what the data can't
The hardest version of the honesty principle is biodiversity.
Species records are sparsest in exactly the richest tropical regions. A data-poor map can look like a nature-poor place, and that could be the most dangerous misread in the product — it would let someone conclude a rainforest is empty because nobody has surveyed it.
So the platform flags when record counts are low relative to what the ecoregion should hold: the difference between nothing lives here and no one has surveyed here.
The design problem underneath is harder than it sounds. Every incentive in a data product pushes toward looking confident — an interface that hedges reads as broken. The task was to make the product say I don't know in a way a non-expert would actually act on rather than skim past. That's why every claim the AI makes carries how it's known: observed, derived, inferred, or projected. Not a disclaimer at the bottom. A property of each individual sentence.
Two ways in
Start from a place, or start from a material.
I'd always had a conviction that materials and place belong connected — that the people making sourcing and design decisions need to see a commodity and its landscape as one thing. We built the spatial side first: draw a location, get its ecological picture. But talking to companies surfaced the wall — most don't have the location data deep spatial analysis needs. That told me when to build the other half.
A commodity carries its own ecological signature: coffee depends on native bees, cocoa on midges; each crop has a water relationship and a set of ecosystems its cultivation threatens or depends on. So the product opens two ways — start from a place, or start from a material. Fusing them is what I'm working on now.
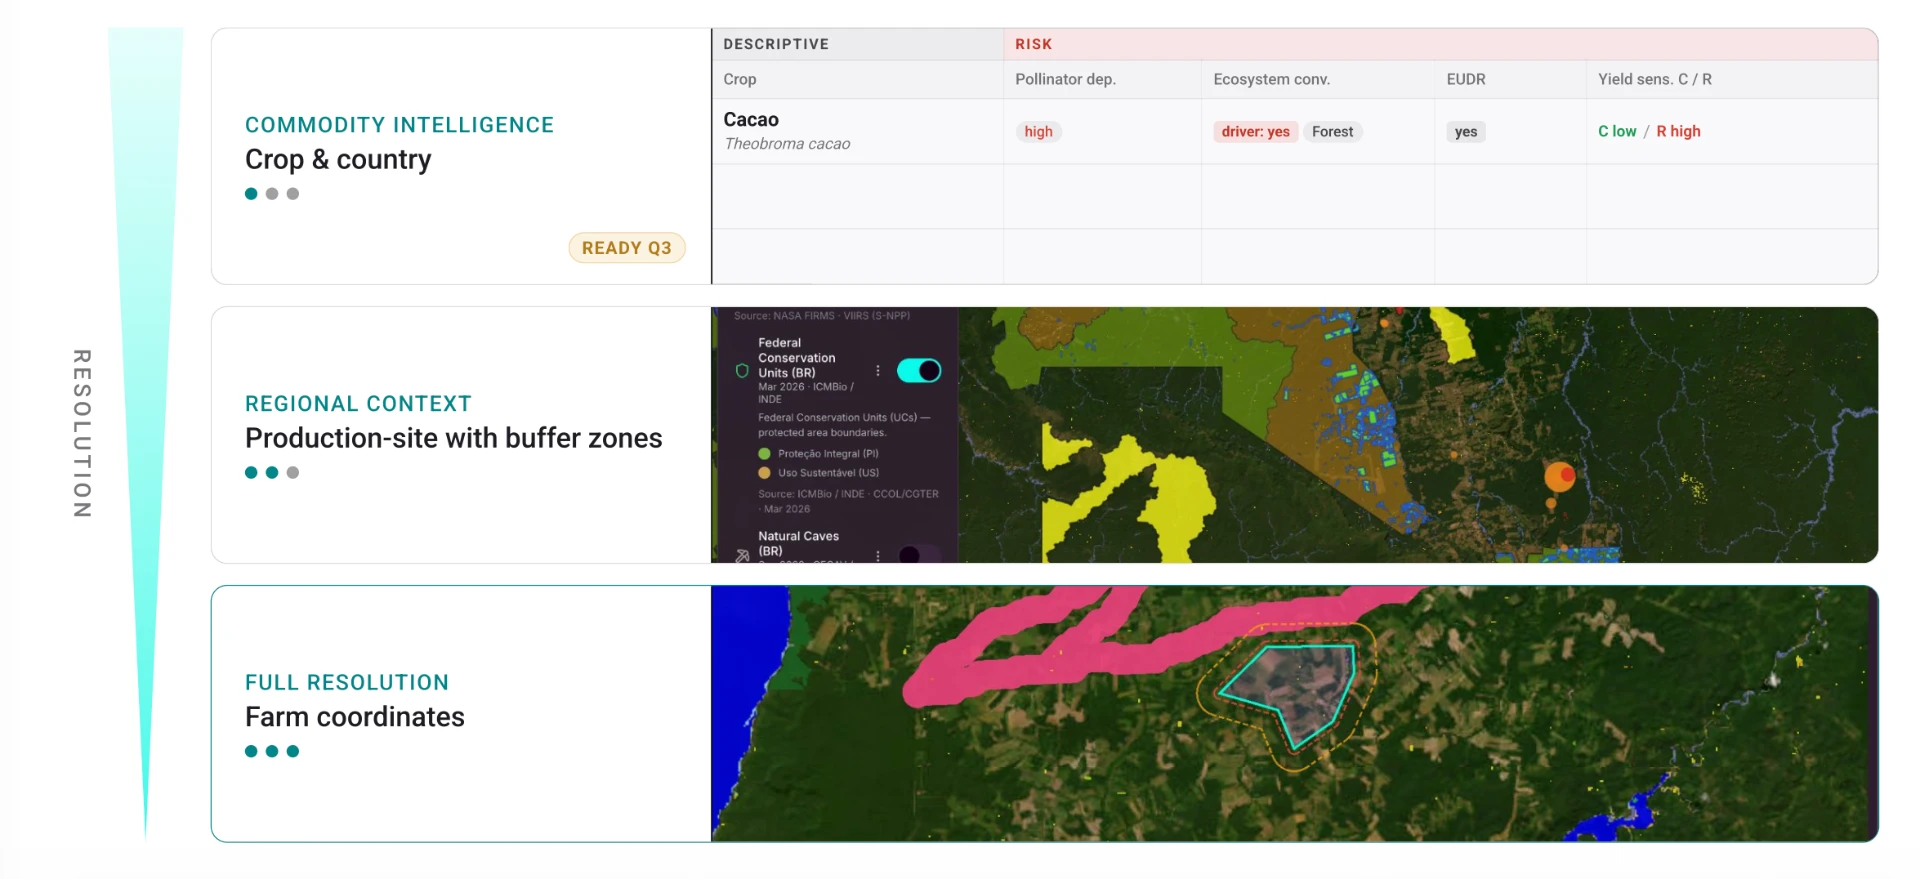
Down to the geometry
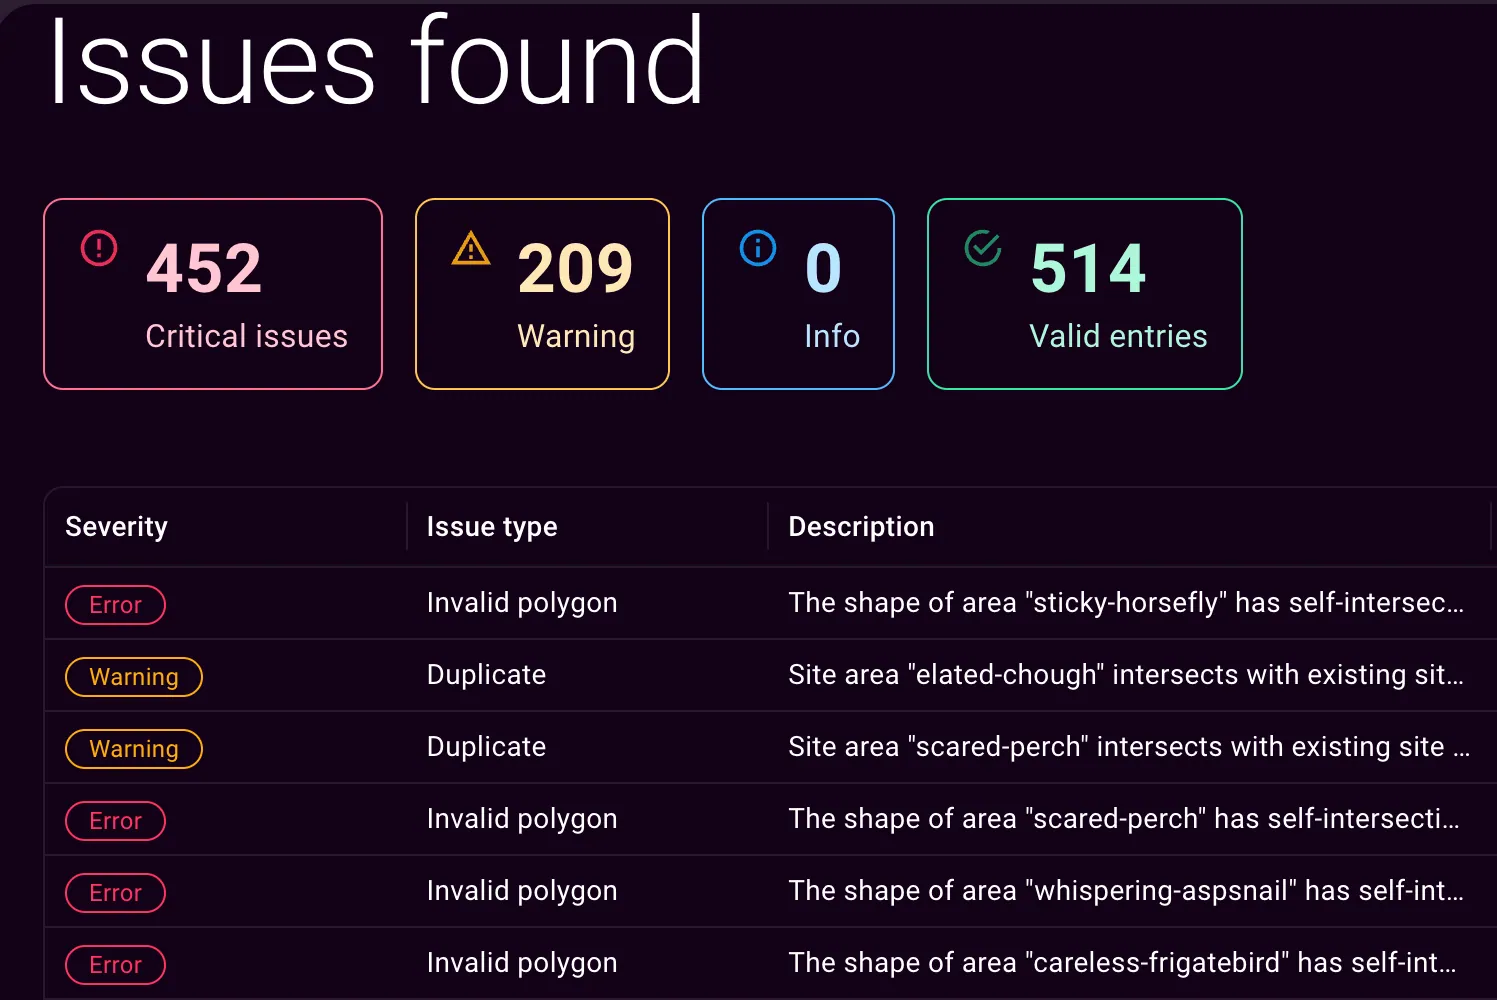
I tested multiple GIS tools and one thing they all had in common was that geometry errors were not shown and sometimes just silently failed an upload. So we built a user-friendly polygon uploader with immediate geometry checks, flagged in user-understandable language, and offering mitigation paths.
The principles, written first
What not to do, written down before anything was built.
- Not only risk-based.
- Not over-simplified — simplicity is the goal, but over-simplification is a lie.
- Nothing that makes greenwashing easy.
- Old data shown as old, because time changes what a number means.
- And no "insight" that looks meaningful alone but misrepresents once you see its context.
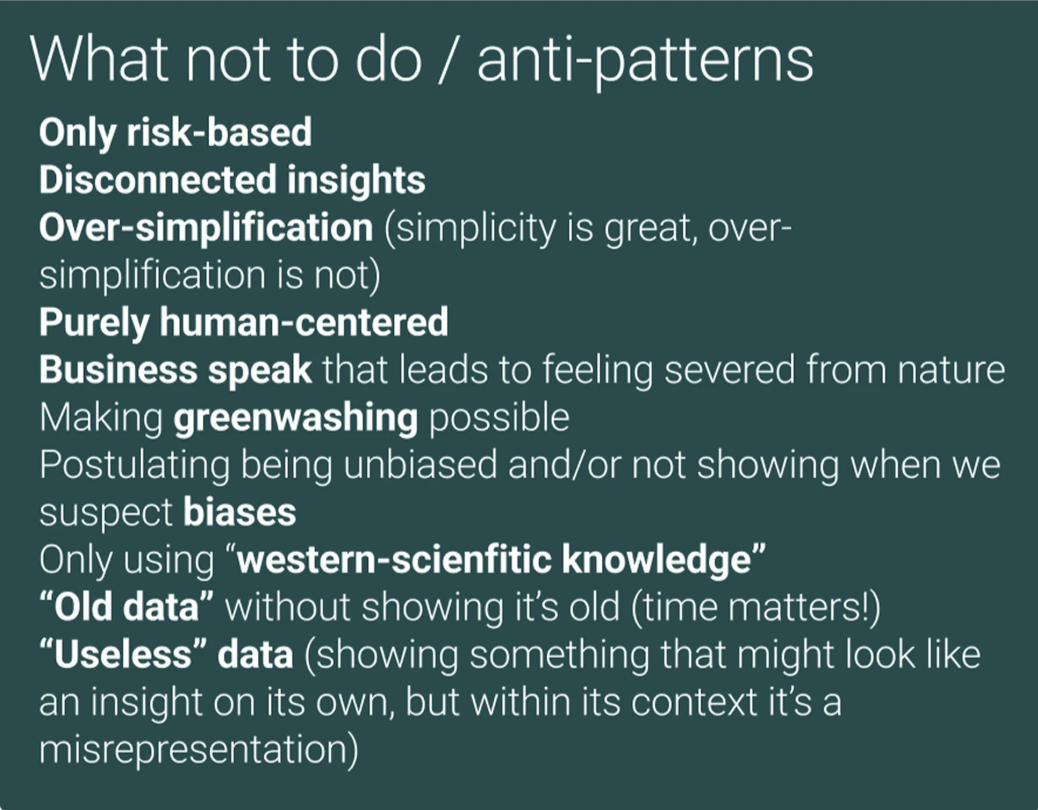
Card from a Figma work file
Backend- and infrastructure-first
The buyer moved, the product didn't have to.
Sustainability leads are the obvious buyer in nature — the title has the word in it. But talking to them, the pattern was consistent: attention on carbon, output a report. We do neither. Reporting is a by-product of what Archaster does, not the reason for it. Some teams work more holistically and are still our target users; most aren't who we lead with.
The people whose decisions turn on the condition of a specific place are elsewhere: sourcing and procurement choosing suppliers, design and materials teams choosing what a product is made of, restoration teams choosing where to put money in the ground. Deciding, not documenting.
Changing who we led with doesn't cost our product, and that was the plan all along. The data basis doesn't vary too much by use case. What varies is who's asking and what they're deciding. So we built the layers, the reasoning, and the geometry validation first, audience-agnostic, and treated the interface as the part that changes.
Building with one and a half people
Two founders, a part-time CTO, no outside money.
Every decision was really a decision about what not to build yet.
The pattern that made it survivable: find the layer of the problem that doesn't vary, build that, and keep everything above it cheap to change.
The backend before any audience-specific front end: because the data basis is the same whichever use case you're serving.
Layers chosen against decisions rather than verticals: which is why they transferred when the buyer moved.
One global invasive-species layer before any national one: because it covers the globe and is a fallback when we don't have country-specific data yet. Germany and Norway got their own datasets because interest pulled them.
Gallery
Explore the product and process artifacts
Available for fractional and project work
Tell me what you're building, where it's stuck, and when you need someone. I'll tell you honestly whether I'm the right person.